34. Monitoring & Performance
Learning objectives
- Use monitoring data to confirm expected production.
- Interpret the performance ratio and spot underperformance.
34.1 Monitoring platforms
Modern systems report through inverter and MLPE portals, with revenue-grade meters added on larger systems. MLPE gives module-level visibility; string inverters give string-level. Either way, the goal is comparing actual to expected production continuously, with automated fault alerts. Data flows from on-site devices (inverters, meters, sensors) through a local or cellular gateway to a cloud platform where trend analysis and alerts run.
34.2 Performance ratio
The headline metric is the Performance Ratio (PR) per IEC 61724-1: actual energy ÷ the energy the array should have produced for the measured irradiance, independent of weather. This isolates system health from weather variation. Well-functioning systems typically run PR ~0.75–0.85+. A falling PR signals soiling, shading growth, a failing component, or degradation. Track specific yield (Ch 14.3) over time as a second gauge; both metrics decline gradually as modules degrade at roughly 0.6–1%/yr.
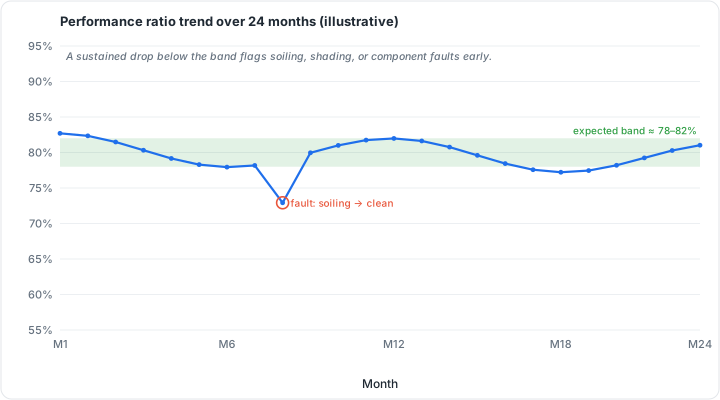 Figure 34.1: Performance-ratio trend over 24 months (illustrative): a sustained drop below the expected band flags a fault early. Original figure.
34.3 Worked example: performance ratio
An 8 kW array at a site delivering 5.0 kWh/m²/day of plane-of-array irradiance should, at STC reference, produce 8 kW × 5.0 h = 40 kWh on an ideal day. It actually meters 33 kWh. PR = actual ÷ reference-expected = 33 ÷ 40 = 0.825, which is healthy (typical 0.75–0.85+). If next year the same conditions yield only 29 kWh, PR falls to 0.725, a flag to investigate soiling, new shading, a failing optimizer/inverter, or degradation. ⚠️ Because PR normalizes for weather, a falling PR is a system problem, not a cloudy month.
Chapter 34 summary
Monitor actual-vs-expected production via inverter/MLPE platforms with alerts. The performance ratio (~0.75–0.85+) is the weather-independent health metric; a declining PR or specific yield flags soiling, shading, faults, or degradation.
- MLPE (Module-Level Power Electronics): per-module microinverters or DC optimizers that give panel-level production and fault visibility.
- Revenue-grade meter: a high-accuracy energy meter used on commercial systems for billing or incentive measurement.
- Performance Ratio (PR): actual energy output divided by weather-normalized expected output (IEC 61724-1); the primary system health metric.
- Specific yield: annual energy per kWp of installed capacity; a long-run production gauge used alongside PR.
- Plane-of-array (POA) irradiance: solar irradiance in the tilted plane of the array, the correct input for yield and PR calculations.
- Fault alerts: automated notifications from the monitoring platform when measured production falls outside the expected range.
Full definitions: Appendix A (glossary).
Practice Problems: Chapter 34
- An array’s ideal-condition expected output is 45 kWh; it meters 36 kWh. What is the performance ratio?
- Is a PR of 0.80 healthy or concerning?
- Why is PR more diagnostic than raw kWh when judging system health month to month?
- A system’s PR drifts from 0.83 to 0.70 over two years with no weather change. Name three likely causes.
- What monitoring granularity does MLPE add over a plain string inverter?
Solutions: Chapter 34
- 36 ÷ 45 = 0.80.
- Healthy: squarely in the typical 0.75–0.85+ band.
- PR normalizes for weather/irradiance, so changes reflect the system (soiling, faults, degradation), not sunshine.
- Any three: soiling buildup, encroaching shade (tree growth), a failing inverter/optimizer, connector degradation, or module degradation.
- Module-level visibility (per-panel data), versus string-level only.