42. Industry Structure & Market Segments
Learning objectives
- Distinguish the market segments and their dynamics.
- Map the value chain and installer types.
42.1 The segments
- Residential: rooftop systems on homes; the most labor-intensive per watt and the segment where most installer jobs sit, but a small share of capacity. US residential installed ~4.6 GWdc in 2025 (down ~2%), pressured by high interest rates and state net-metering reform (notably California’s NEM 3.0).
- Commercial & Industrial (C&I): businesses, warehouses, institutions; mid-scale.
- Community solar: shared arrays serving subscribers.
- Utility-scale: large fields/farms; the dominant capacity segment, with the US on an outlook around 35 GWdc/year through 2030.
Overall, the US installed about 43 GWdc in 2025, its fifth straight year as the top source of new generating capacity.
42.2 The value chain and the players
Manufacturing (cells/modules/inverters) → distribution → developers/EPCs → installers → O&M → financing. Installers range from national firms to regional and local shops; some self-perform, others subcontract.
⚠️ The industry is cyclical and policy-sensitive. High interest rates and policy shifts drove notable bankruptcies (SunPower in 2024; Sunnova and Solar Mosaic in 2025), a reminder that demand swings with rates, incentives, and net-metering rules. Installation and project development make up roughly two-thirds of the industry’s ~280,000+ US jobs.
42.3 The market segments (US, ~2025 snapshot: figures age)
| Segment | Scale | Capacity share | Job intensity |
|---|---|---|---|
| Residential | kW (homes) | small (~4.6 GWdc/yr) | highest per watt (most jobs) |
| Commercial & Industrial | kW–MW | mid | medium |
| Community solar | shared MW | small-mid | medium |
| Utility-scale | MW–GW | dominant (~35 GWdc/yr outlook) | lowest per watt |
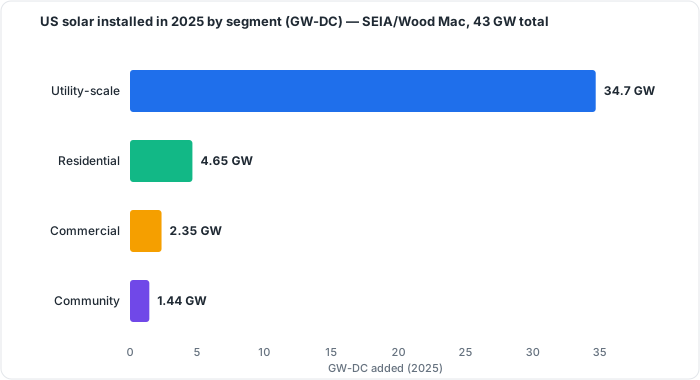 Figure 42.1: US solar installed in 2025 by segment (GW-DC); SEIA/Wood Mac, ~43 GW total. Original figure.
⚠️ Snapshot only: the US added ~43 GWdc in 2025; segment splits, prices, and the policy backdrop move yearly.
Chapter 42 summary
Four segments sit on a chain from manufacturing through installation to O&M and finance: residential (most jobs, modest capacity), C&I, community, and the capacity-dominant utility-scale. The US added ~43 GWdc in 2025, led by utility-scale. The business is cyclical and policy-driven, with real bankruptcy risk when rates and incentives turn.
- Residential: rooftop home systems; highest job intensity per watt, modest share of total installed capacity.
- C&I (Commercial & Industrial): business and institutional systems at kW-to-MW scale.
- Community solar: shared arrays where subscribers receive bill credits rather than hosting their own array.
- Utility-scale: MW-to-GW ground-mount fields; dominant capacity segment (~35 GWdc/yr outlook through 2030).
- EPC (Engineering, Procurement, and Construction): contractor managing full project delivery from design through installation.
- O&M (Operations & Maintenance): ongoing services keeping a commissioned system producing.
- Value chain: the sequence manufacturing → distribution → developers/EPCs → installers → O&M → financing.
Full definitions: Appendix A (glossary).
Practice Problems: Chapter 42
- Which segment dominates installed capacity, and which holds the most jobs?
- Why is residential the most job-intensive segment per watt?
- Trace the industry value chain from raw module to finished, operating system.
- Name two forces that drove recent solar-company bankruptcies.
Solutions: Chapter 42
- Utility-scale dominates capacity; residential holds the most jobs.
- Small rooftop systems require more labor per watt (site work, custom design, roof attachment) than large repetitive utility fields.
- Manufacturing → distribution → developers/EPCs → installers → O&M → financing.
- High interest rates and policy/net-metering shifts (e.g., California NEM 3.0; the 25D change).